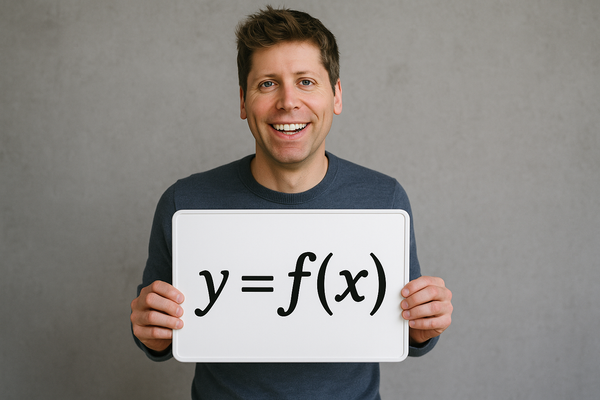
#002: f(x) Fridays: The Ocean Equation — Mapping Pollution, Modeling Change

Welcome to our very first f(x) Fridays, where we tackle real-world problems through the lens of y = f(x). Today we’re diving deep—literally—into a crisis affecting every continent, every community, and every coastline: ocean pollution.
From swirling plastic gyres to dying coral reefs, the oceans are absorbing the costs of human progress. But what if we could treat this crisis like a system—map the inputs, model the transformation, and generate outputs that offer real, scalable hope?
The Problem Below the Surface
Oceans cover more than 70% of our planet. They regulate climate, support marine life, and feed billions. Yet every year, over 11 million metric tons of plastic waste enters the seas[1]—along with chemical runoff, heavy metals, oil spills, and discarded fishing gear .
Marine species ingest or become entangled in debris. Coral reefs bleach and die. Coastal communities lose their livelihoods. What we’re witnessing isn’t just environmental decline—it’s ecological collapse.
Reframing the Problem:
Let’s apply our favorite formula: y = f(x)
x = Inputs
- Satellite imagery of ocean surfaces and currents
- River pollution inflow data
- Fishing routes and maritime traffic logs
- Microplastic concentrations by region
- Climate and ocean temperature trends
- Port and shipping waste records
f = The Function (AI tools applied)
- Computer vision to detect floating debris in satellite images
- Predictive modeling to trace the flow of waste across currents
- Deep learning algorithms to forecast plastic accumulation zones
- NLP to mine maritime reports and incident logs
- Optimization models for cleanup operations (drones, boats, booms)
y = Outputs
- Hotspot maps for intervention prioritization
- AI-coordinated cleanup routes for autonomous vessels
- Predictive alerts for plastic surges post-storm or flood
- Policy simulations for reducing industrial runoff
- Real-time dashboards for government, NGOs, and the public
This is how AI becomes a stewardship tool—by identifying where, how, and when to act.
A Real-World Example: The Great Pacific Garbage Patch
One of the most striking examples of ocean pollution is the Great Pacific Garbage Patch—a massive concentration of marine debris located between Hawaii and California. It’s estimated to span over 1.6 million square kilometers, with more than 1.8 trillion pieces of plastic floating across its surface[2].
x: Data from aerial surveys, ocean current simulations, microplastic sampling expeditions, and global shipping routes.
f: AI models using satellite imagery and machine learning to map debris concentration, ocean current tracking to model plastic migration, and fleet optimization algorithms guiding The Ocean Cleanup’s autonomous systems.
y: The development of high-impact collection zones, reduction of plastic by thousands of tons, and influence on international awareness and plastic reduction policy.
This isn’t hypothetical. It’s a real, evolving test case of how y = f(x) can apply to one of the largest environmental threats facing our oceans.
What This Teaches Us
- Pollution is not random. It follows patterns. And patterns can be modeled.
- Cleanup is expensive—but optimization can stretch every dollar.
- Public pressure is powerful—but real-time data makes it actionable.
If We Do Nothing: The Rising Toll
What happens if we ignore the Great Pacific Garbage Patch? The damage compounds in silence, year after year.
- Marine ecosystems collapse: Turtles, fish, whales, and seabirds mistake plastic for food. Over 700 species are already affected, some critically endangered. Plastics also absorb toxins, turning marine life into carriers of poison.
- Microplastics enter the human food chain: As plastic breaks down, it infiltrates the water column and enters fish—and then us. Studies have found microplastics in human blood, lungs, and even placenta.
- Coastal economies suffer: Tourism declines. Fisheries collapse. Cleanup costs rise into the billions. The ocean stops being a source of livelihood and becomes a liability.
- Climate impact worsens: Plastic production and breakdown emit greenhouse gases. Sunlight and heat accelerate this process, feeding the very crisis that drives sea-level rise.
- A cultural disconnect deepens: The longer we ignore the ocean’s cry for help, the harder it becomes to reconnect, to care, to act.
From Crisis to Clarity
y = f(x) reminds us that even global, diffuse problems can be broken down. Measured. Modeled. Improved.
The ocean gave rise to life itself. Maybe now, with the help of data and AI, we can give something back.
Until next week, stay curious—and keep transforming your inputs.
– Sandeep Pamulaparthi & Laxmi Nanditha Vijay
Founders, yequalsfofx.com
References:
[1] Pew Charitable Trusts & SYSTEMIQ. (2020). Breaking the Plastic Wave: A Comprehensive Assessment of Pathways Towards Stopping Ocean Plastic Pollution. Retrieved from https://www.pewtrusts.org/en/research-and-analysis/reports/2020/07/breaking-the-plastic-wave
[2] The Ocean Cleanup. (2022). The Great Pacific Garbage Patch. Retrieved from https://theoceancleanup.com/great-pacific-garbage-patch/


